SFI MVLEM - Cyclic Shear-Flexure Interaction Model for RC Walls
- Command_Manual
- Tcl Commands
- Modeling_Commands
- model
- uniaxialMaterial
- ndMaterial
- frictionModel
- section
- geometricTransf
- element
- node
- sp commands
- mp commands
- timeSeries
- pattern
- mass
- block commands
- region
- rayleigh
- Analysis Commands
- Output Commands
- Misc Commands
- DataBase Commands
Developed and Implemented by:
Kristijan Kolozvari, California State University, Fullerton
Kutay Orakcal, Bogazici University, Istanbul, Turkey
John Wallace, Univeristy of California, Los Angeles
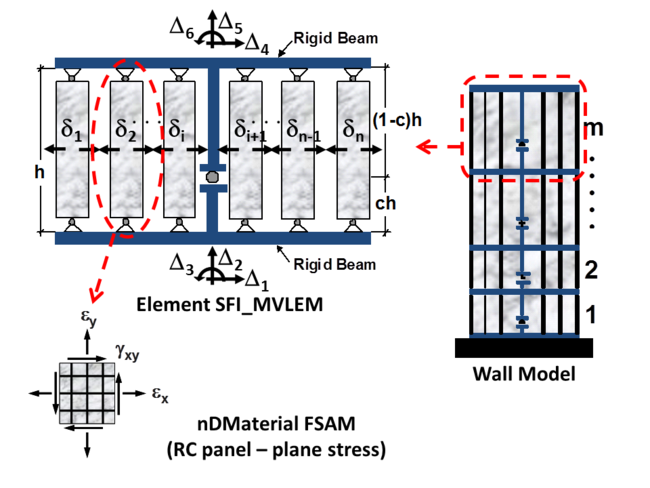
The SFI_MVLEM command is used to construct a Shear-Flexure Interaction Multiple-Vertical-Line-Element Model (SFI-MVLEM, Kolozvari et al., 2015a, b, c), which captures interaction between axial/flexural and shear behavior of RC structural walls and columns under cyclic loading. The SFI_MVLEM element (Figure 1) incorporates 2-D RC panel behavior described by the Fixed-Strut-Angle-Model (nDMaterial FSAM; Ulugtekin, 2010; Orakcal et al., 2012), into a 2-D macroscopic fiber-based model (MVLEM). The interaction between axial and shear behavior is captured at each RC panel (macro-fiber) level, which further incorporates interaction between shear and flexural behavior at the SFI_MVLEM element level.
Source: /usr/local/cvs/OpenSees/SRC/element/SFI_MVLEM/
Input Format:
| Element SFI_MVLEM $eleTag $iNode $jNode $m $c -thick {Thicknesses} -width {Widths} -mat {Material_tags} |
| $eleTag | Unique element object tag |
| $iNode $jNode | End node tags |
| $m | Number of element macro-fibers |
| $c | Location of center of rotation with from the iNode, c = 0.4 (recommended) |
| {Thicknesses} | Array of m macro-fiber thicknesses |
| {Widths} | Array of m macro-fiber widths |
| {Material_tags} | Array of m macro-fiber nDMaterial1 tags |
1SFI_MVLEM element shall be used with nDMaterial FSAM, which is a 2-D plane-stress constitutive relationship representing reinforced concrete panel behavior.
Element Recorders:
The following recorders are available with the SFI_MVLEM element:
| globalForce | Element global forces |
| Curvature | Element curvature |
| ShearDef | Element shear deformation |
| RCPanel $fibTag $Response | Returns RC panel (macro-fiber) $Response for a $fibTag-th panel (1 ≤ fibTag ≤ m). For available $Response-s refer to nDMaterial FSAM. |
Examples:
Element SFI_MVLEM 1 1 2 5 0.4 -thick 6 6 6 6 6 -width 9 10 10 10 9 -mat 7 6 6 6 7
Recorder Element -file SFI_MVLEM_Fgl.out -time -ele 1 2 3 globalForce
Recorder Element -file SFI_MVLEM_panel_strain.out -time -ele 1 RCPanel 1 panel_strain
References:
1) Kolozvari K., Orakcal K., and Wallace J. W. (2015a). "Shear-Flexure Interaction Modeling of reinforced Concrete Structural Walls and Columns under Reversed Cyclic Loading", Pacific Earthquake Engineering Research Center, University of California, Berkeley, PEER Report No. 2015/12
2) Kolozvari K., Orakcal K., and Wallace J. W. (2015b). ”Modeling of Cyclic Shear-Flexure Interaction in Reinforced Concrete Structural Walls. I: Theory”, ASCE Journal of Structural Engineering, 141(5), 04014135 doi
3) Kolozvari K., Tran T., Orakcal K., and Wallace, J.W. (2015c). ”Modeling of Cyclic Shear-Flexure Interaction in Reinforced Concrete Structural Walls. II: Experimental Validation”, ASCE Journal of Structural Engineering, 141(5), 04014136 doi
4) Kolozvari K. (2013). “Analytical Modeling of Cyclic Shear-Flexure Interaction in Reinforced Concrete Structural Walls”, PhD Dissertation, University of California, Los Angeles.
Example 1. Simulation of Shear-Flexural Behavior of a Medium-Rise RC Wall Specimen under Cyclic Loading using the SFI-MVLEM Model
The behavior of RC wall specimen RW-A15-P10-S78 (Tran and Wallace, 2012) tested under constant axial load and cyclic lateral displacement history applied at the top of the wall is predicted using the SFI_MVLEM model. The input parameters and output results are presented in the following sections.
E1.1. Model Calibration
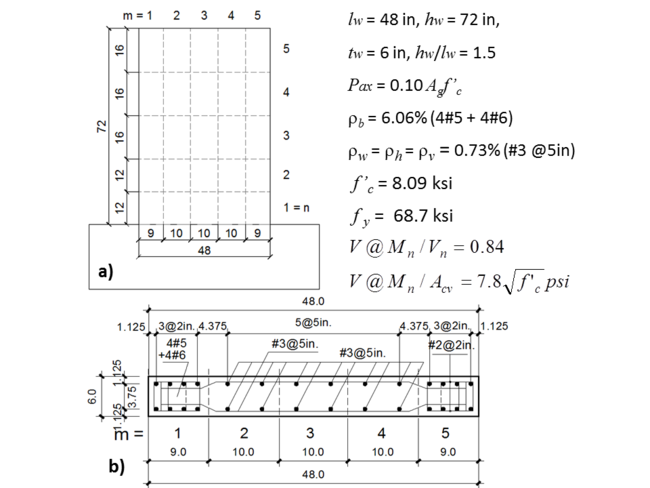
Basic properties of the specimen with model discretization are shown on Figure E1.1. Detailed information about the test specimen can be found in paper by Tran and Wallace (2012), whereas details of model calibration are provided by Kolozvari (2013) and Kolozvari et al. (2015b).
E1.2. Input Files
Input files (.tcl) used to build the wall model and perform displacement-controlled analysis can be found in Example 1. SFI_MVLEM.zip:
- SFI_MVLEM_SP4.tcl – model generation and definition of analysis parameters
- gravity.tcl – application of gravity load
- dispControl.tcl – application of lateral displacement history (run this file)
- LibAnalysisStaticParameters.tcl - definition of static analysis parameters
- LibGeneratePeaks.tcl - generation of displacement history
E1.3. Analysis Results
The following sub-section presents analytical results obtained for the test specimen described above, using the input files provided. The results include global wall responses (compared against experimental results), model element responses, and individual RC panel (macro-fiber) responses.
E1.3.1. Global Wall Responses
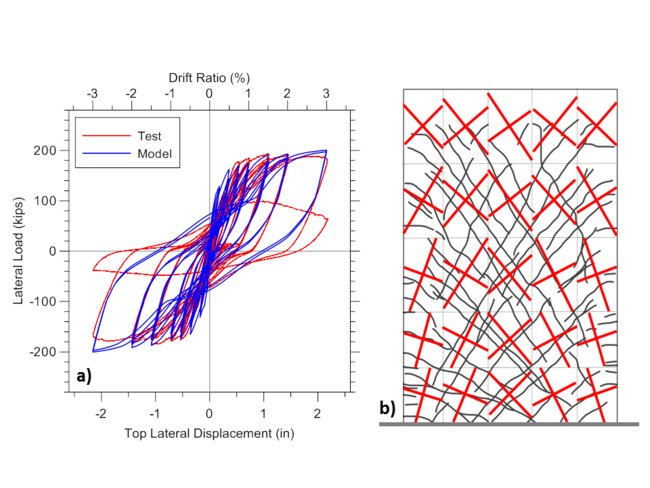
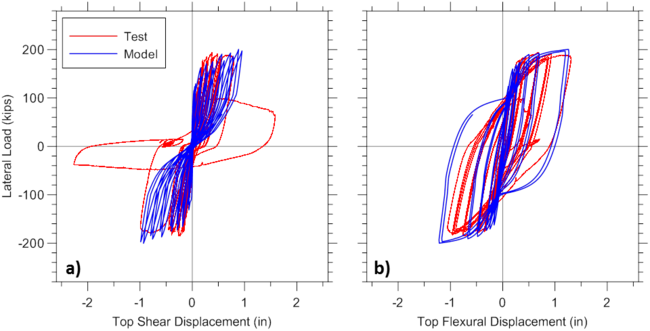
Analytical and experimental lateral load versus top total displacement responses and wall cracking patterns are presented on Figure E1.2, whereas lateral load versus flexural and shear deformations are shown on Figure E1.3. Total top displacement is obtained from the top node, shear force is recorded using globalForce element recorder, total shear displacement is obtained using shearDef element recorder and crack orientations are obtained using RCPanel and cracking_angles element recorders.
E1.3.2. Model Element Responses
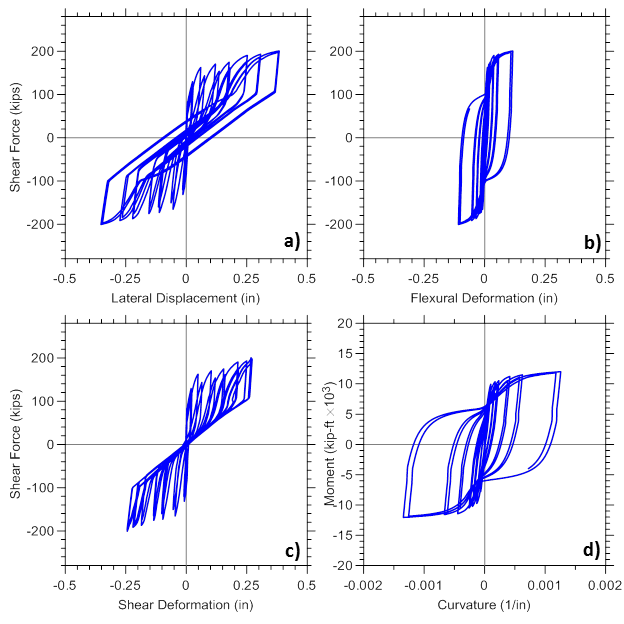
Figure E1.4 plots lateral load versus total, flexural and shear displacement responses, as well as moment versus curvature relationship, obtained from the analysis for the bottom wall model element. Responses are recorded using globalForce, ShearDef, and Curvature element recorders.
E1.3.3. Reinforced Concrete Panel Responses
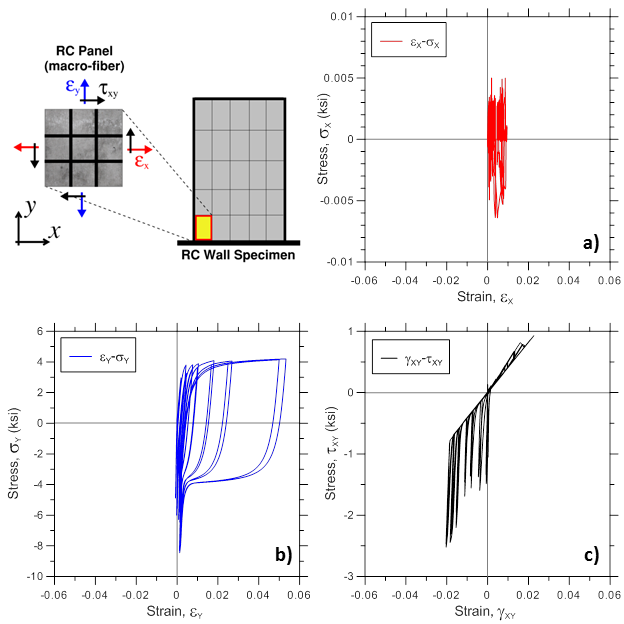
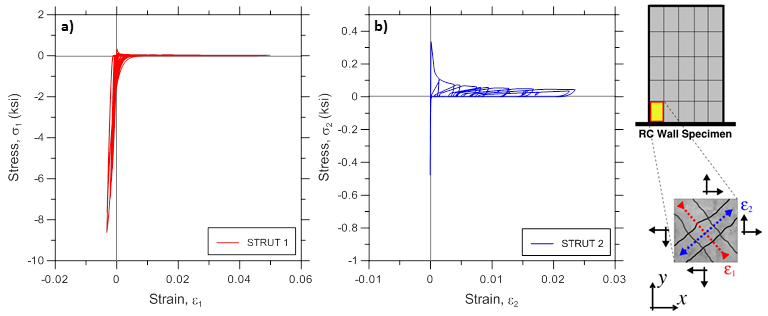
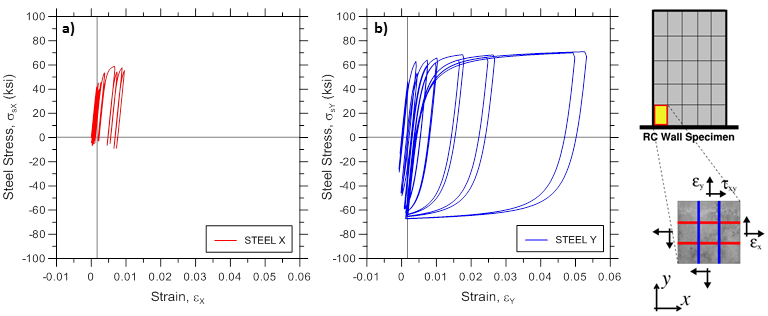
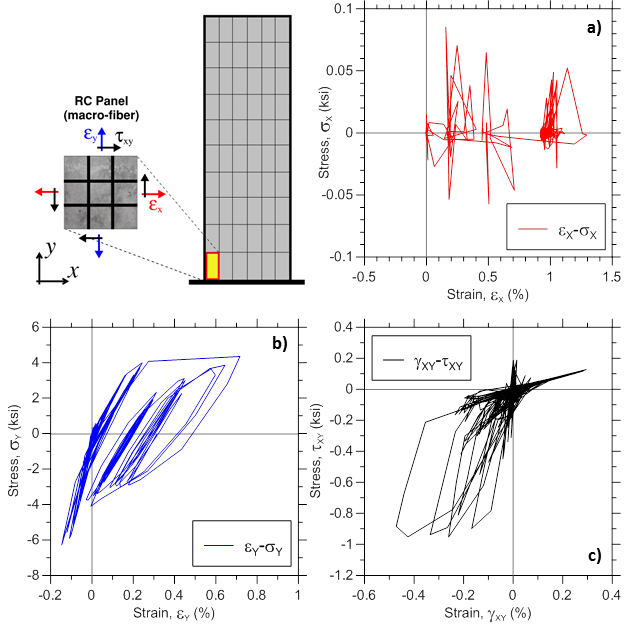
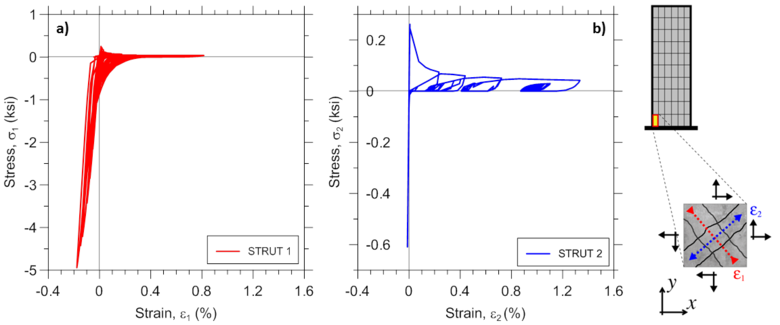
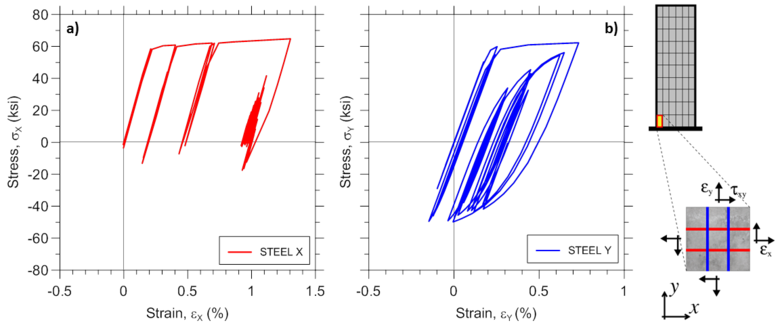
Various stress-strain responses for an individual boundary panel element (outermost macro-fiber) within the bottommost wall element are presented, including total (resultant) stress vs. strain relationships in the xy plane (Figure E1.5; element RCPanel recorders: panel_strain and panel_stress), stress-strain relationships along the two concrete struts (Figure E1.6; element RCPanel recorders: strain_stress_concrete1 and strain_stress_concrete2), and stress-strain relationship along horizontal and vertical steel reinforcement (Figure E1.7; element RCPanel recorders: strain_stress_steelX and strain_stress_steelY).
Example 2. Dynamic Analysis of a Coupled Wall-Frame System
This example illustrates application of the SFI_MVLEM wall model for nonlinear dynamic analysis. Analytical model of a coupled wall-frame building system was generated and analyzed under a single ground motion time-history. Brief description of the building characteristics and the analytical model are provided in the following sections.
E2.1. Building Description
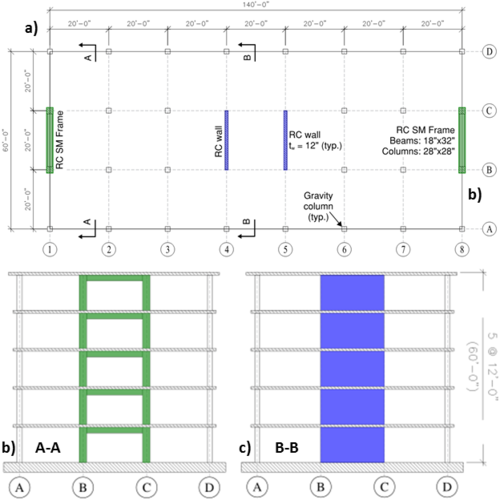
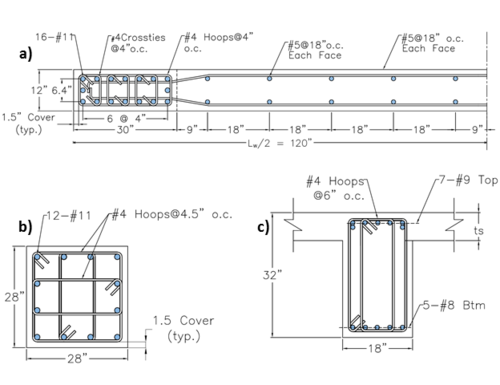
Plan and elevation/section views of the considered building are shown in Figure E2.1. The building footprint is 140 ft × 60 ft, with 20 ft long spans. Analysis is conducted for shaking in the transverse direction only, where the lateral-force-resisting elements include two identical one-bay frames located at the building perimeter (axis 1 and 8, Figure E2.1a) and two identical walls located near the center of the building (axis 4 and 5, Figure E2.1a). Structural design is performed for a residential building (I=1.0, risk category I, design category D; ASCE 7-10 S11.5 and S11.6) for uniformly distributed dead load of 150 psf and live load of 40 psf (ASCE 7-10, Table 4-1), as well as the earthquake lateral loading obtained using Equivalent Lateral Force Procedure of ASCE 7-10 (S12.8). The frame was designed to resist 25% of the earthquake lateral load (Dual System, ASCE 7-10). Concrete compressive strength of f’c = 5,000 psi and reinforcing steel (both longitudinal and transversal reinforcement) with yield strength fy = 60,000 psi were used. Based on the structural design, cross-section dimensions of 12 in × 240 in (walls), 18 in × 32 in (beams; width × depth), and 28 in × 28 in (columns) were adopted. Cross-sections of structural elements with the reinforcement detailing are provided in Figure E2.2.
E2.2. Analytical Model Description
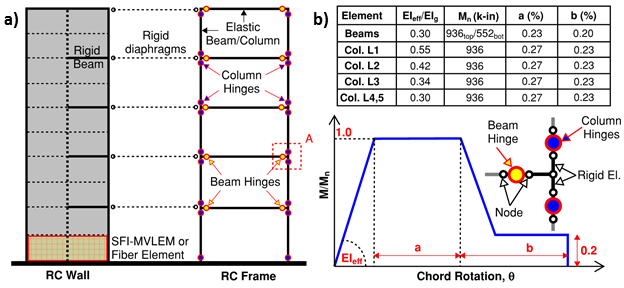
Due to building symmetry and applied direction of the ground motion, a two-dimensional model consisting of one frame and one wall (Figure E2.3) is used to simulate the building behavior. The gravity system is not included in the model (ASCE 7-10) and the assumption of a rigid diaphragm is implemented within each story level. Tributary mass is assigned at the element nodes at each story level at locations of axes of the vertical elements (i.e., wall and columns), whereas gravity load (dead and live) was assigned according to corresponding tributary areas as either nodal load at wall-element nodes of each story or uniformly distributed load along the beams of the frame.
As show on Figure E2.3, the RC wall is modeled using ten equal-length SFI_MVLEM elements along the wall height (i.e., two elements per story height). Wall discretization in horizontal direction was performed using six macro-fibers to represent the wall cross section, where two outer macro-fibers were used to represent the confined wall boundaries and the remaining four represent the unconfined wall web. Material models for steel and concrete are calibrated based on adopted material strengths to represent the behavior of confined and unconfined concrete and reinforcing steel.
RC frame elements (i.e., beams and columns) are modeled using elastic beam-column elements by assuming the location of plastic hinges at the faces of beam-column joints (Figure E2.3a), the behavior of which was simulated using zero-length elements at locations of hinges and the elasto-plastic moment-rotation hysteretic model (Modified Ibarra Krawinkler Deterioration Model; Lignos and Krawinkler, 2011), with modeling parameters adopted according to beam and column flexural capacities and the ASCE 41 backbone relationships (Figure E2.3b). The reduction of flexural stiffness after cracking was considered using stiffness modifiers for elastic portions of beam and column elements according to ASCE 41 (Table 6.5).
E2.3. Input Files
Input files (.tcl) used to build the model of a 5-story wall-frame system and perform gravity and dynamic analysis can be found in Example 2. SFI_MVLEM.zip:
- 5storyWF_SFI.tcl – model generation, definition of analysis parameters, gravity analysis
- Modal.tcl – modal analysis
- Dynamic.tcl – application of earthquake acceleration time-history (run this file)
- MCEScaledEQ1X.acc – earthquake acceleration time history file
- DisplayModel2D.tcl - display 2D model
- DisplayPlane.tcl - display plane
E2.4. Dynamic Analysis Results
Results obtained using analytical model of the building described in the previous section are presented, including modal properties of the structure, wall global (i.e., lateral deformations, drifts, shear force, moments) and local (i.e., vertical strains and rotations) responses. Responses of the structural elements comprising the RC frame are not considered.
E2.4.1. Dynamic Properties
First two building fundamental periods and mode shapes are presented in Figure E2.4.

E2.4.2. Time-history Responses
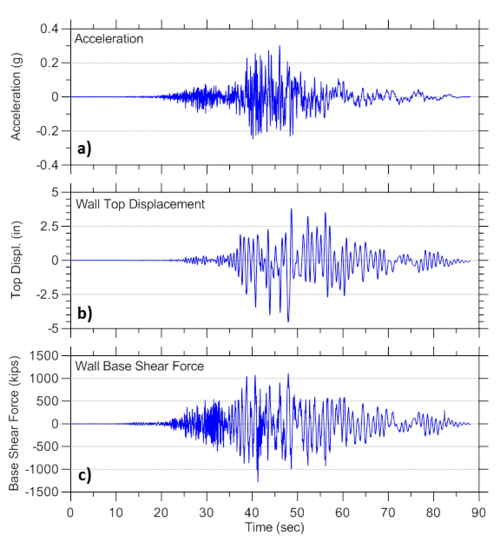
Time histories of ground motion acceleration, wall top nodal displacement, and wall base shear force (bottom wall node reaction) are presented in Figure 2.5; the responses are obtained using globalForce and Reactions node recorders.
E2.4.3. Maximum Global Responses over the Wall Height
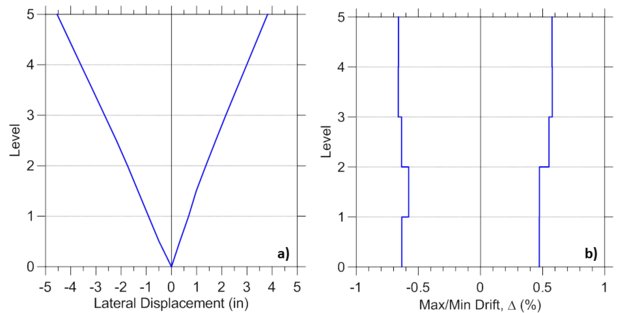
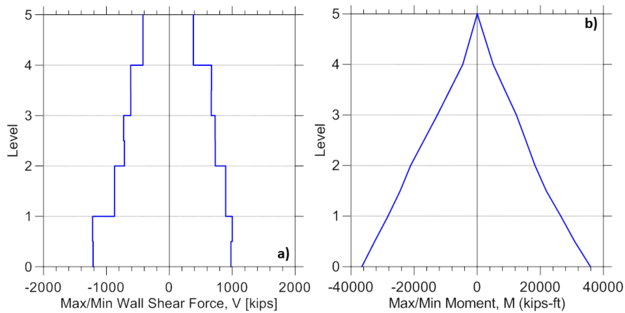
Maximum envelopes of wall lateral displacements and interstory drifts, and shear force and bending moment are presented in Figure E2.6 and Figure E2.7, respectively. Wall lateral displacements and drifts are obtained using corresponding node recorders, disp and drift, whereas shear force and bending moments over the wall height are recorded using element recorders globalForce.
E2.4.4. Bottom Wall Element Responses
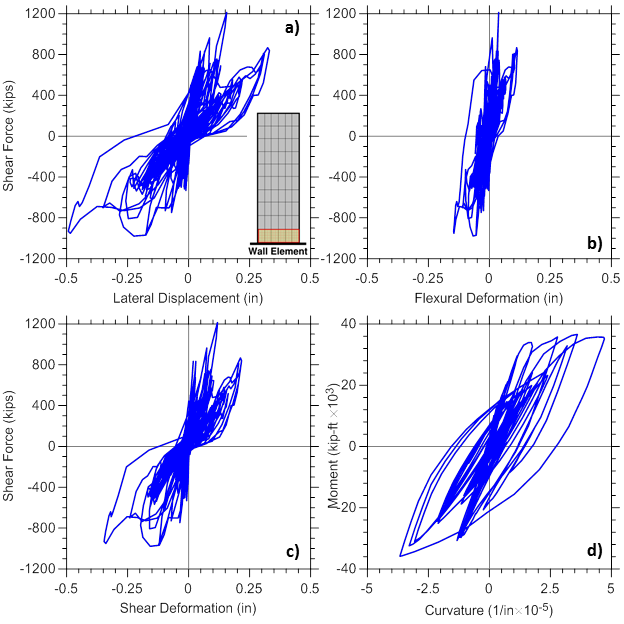
Figure E2.8 plots the responses of the bottom wall element, including lateral load versus total, flexural and shear displacement, and moment versus curvature relationship obtained from the dynamic analysis. Note that wall element shear displacement and curvature time-histories are obtained using SFI_MVLEM element recorders ShearDef and Curvature, respectively, whereas shear force and bending moment are recorded using element recorder globalForce.
E2.4.5. Single RC Panel Responses
Analytically-predicted strain-stress responses of a single RC panel (macro-fiber) located at the left wall boundary of the bottom wall element are presented. Global panel stress-strain relationships presented on Figure E2.9 are obtained using element recorder RCPanel with commands panel_strain and panel_stress; the uniaxial behavior of concrete along the two concrete struts presented on Figure E2.10 are recorded using strain_stress_concrete1 and strain_stress_concrete2 commands; uniaxial stress-strain behavior of horizontal and vertical reinforcing steel presented on Figure E2.11 are obtained using strain_stress_steelX and strain_stress_steelY commands. Other panel responses described in Section 3 could be plotted in a similar manner.
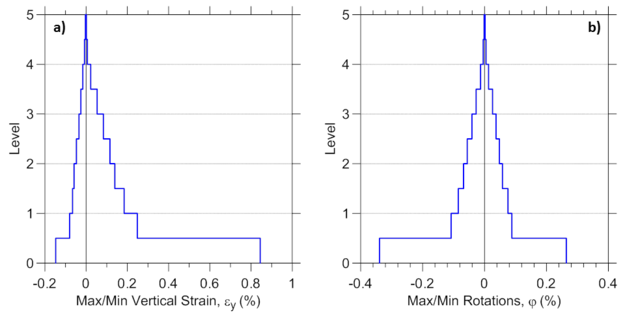
Finally, vertical profiles of maximum vertical strains (Figure E2.12a) are obtained using element recorder with RCPanel and panel_strain recorder commands, whereas maximum wall rotations over the wall height (Figure E2.12b) are derived from element Curvature recorder. Similarly, the distribution of other wall responses could be plotted over the wall height (e.g., shear deformations, etc.).
