One-dimensional Consolidation
Example posted by: Christopher McGann, University of Washington
This article describes the OpenSees implementation of a 1D consolidation model. A single soil column is modeled in two-dimensions, but all compression is one-dimensional. The model can consider either single or double drainage of the soil layer.
The input file needed to execute this analysis, 1Dconsolidation.tcl, is provided along with several helpful Matlab scripts to plot the results, plotPorePressure.m and plotStress.m.
Download them all in a compressed file: consolidation.zip
To run this example, the user must download the file 1Dconsolidation.tcl. Once this has been done, the user can then type "source freeFieldDamp.tcl" into the interpreter of the OpenSees.exe application to run the analysis. The Matlab scripts are not essential to the analysis, however, they are provided to demonstrate how certain plots can be obtained from the recorded output.
Model Description
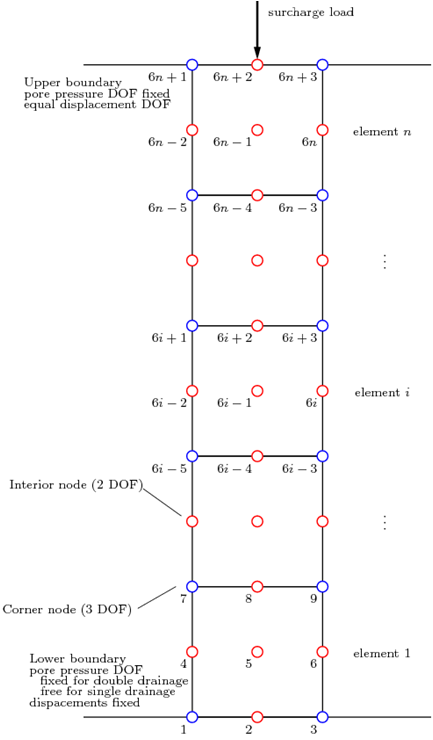
Mesh Geometry
Corner Nodes
Boundary Conditions for Corner Nodes
Interior Nodes
Boundary Conditions for Interior Nodes
Soil Material
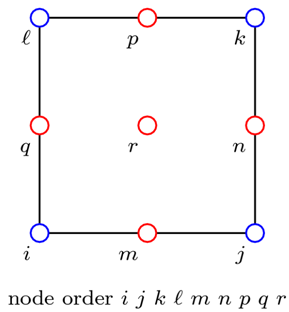
Soil Elements
Gravity Loading
Recorders
Consolidation Analysis
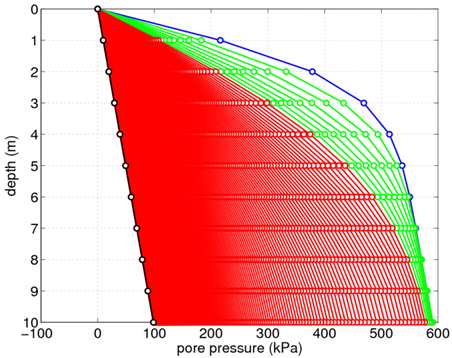
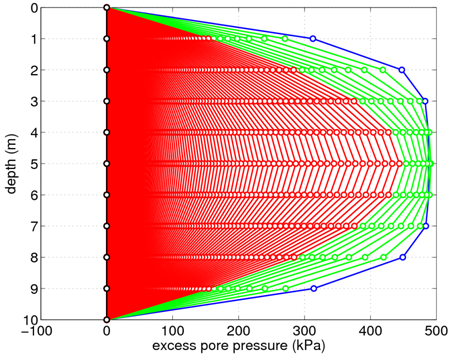
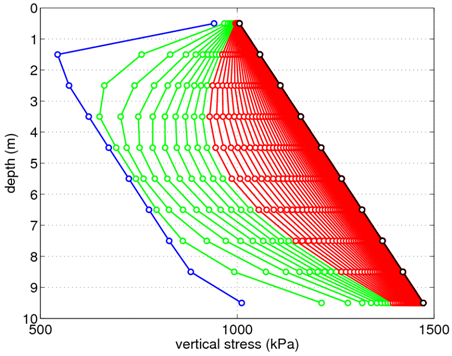
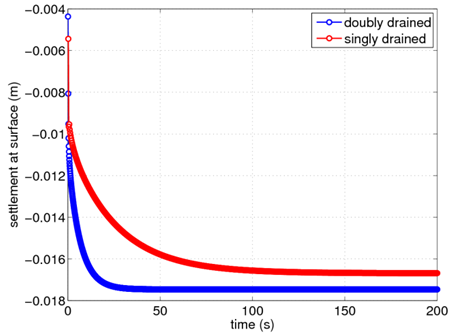
Representative Results
